Your cart is currently empty!
Beyond Backward: Rural Electric Cooperative Leaderships’ Exclusion of Women and Minorities

August 1, 2022
Introduction
The Rural Power Project has been keeping a close eye on the leadership of America’s rural electric cooperatives (RECs) since 2016. That year, ACORN International and Labor Neighbor Research and Training Center published a report that showed an alarming lack of progress in the diversification of the member-elected leaders of RECs. As we put it then, “if the civil or women’s rights movement had reached the South, somehow it had largely missed the supposedly democratic, membership-run rural electric cooperatives.”[1]
As of 2016, REC boards in the South were 90.3% male and 95.3% white. We checked back earlier this year to see what progress they made over the course of 5 or so years. There was some: a 29% increase in women, a 48% increase in Black board members, and a 100% increase in Hispanic board members. But when you start from the bottom, it’s easy to make some progress. That 100% increase in Hispanic board members? It meant the number went from 6 all the way up to 12 – out of the 2,190 board members for whom we determined racial identity.
Our focus has been on the South because the South has nearly half of America’s rural population[2]. But now we’ve broadened the scope of our survey in order to find out whether the severe lack of diversity in the South’s REC boards is a regional anomaly or a national crisis. Our findings paint a clear picture: rural electric cooperatives keep women and minorities locked out of leadership across the country. Below, we delve into both phenomena.
A Glass Ceiling, or Worse? Women’s Exclusion from REC Boards
America’s rural electric cooperatives exclude women from leadership in each of the 47 states they operate in, to an extent unmatched by some of the most grossly male-dominated institutions in our country. For instance, women hold 27% of seats in Congress and they hold 26.5% of Fortune 500 board seats. But REC board seats? Just 12.6%.
Of the 8,059 board members whose sex we determined via public information, 1,027 are women. That means that America’s REC boards aren’t just far behind other American institutions, they’re far behind institutions like Saudi Arabia’s consultative parliament, which reserves 20% of its seats for women.
Simple ratios don’t adequately convey how wide and deep this crisis runs. Consider these facts.
We surveyed 888 cooperatives. Of those, 882 had male-majority boards. There were just 6 (0.68%) exceptions:
- Lincoln Electric Cooperative (Montana; 6 women, 3 men.)
- Middle Kuskokwim Electric Cooperative (Alaska; 4 women, 2 men)
- Lane Electric Cooperative (Oregon; 4 women, 3 men)
- Taylor Electric Cooperative (Wisconsin; 4 women, 3 men)
- South Central Power Company (Ohio; 6 women, 5 men)
- Blachly-Lane Electric Cooperative (Oregon; an even split, 2 men and 2 women).
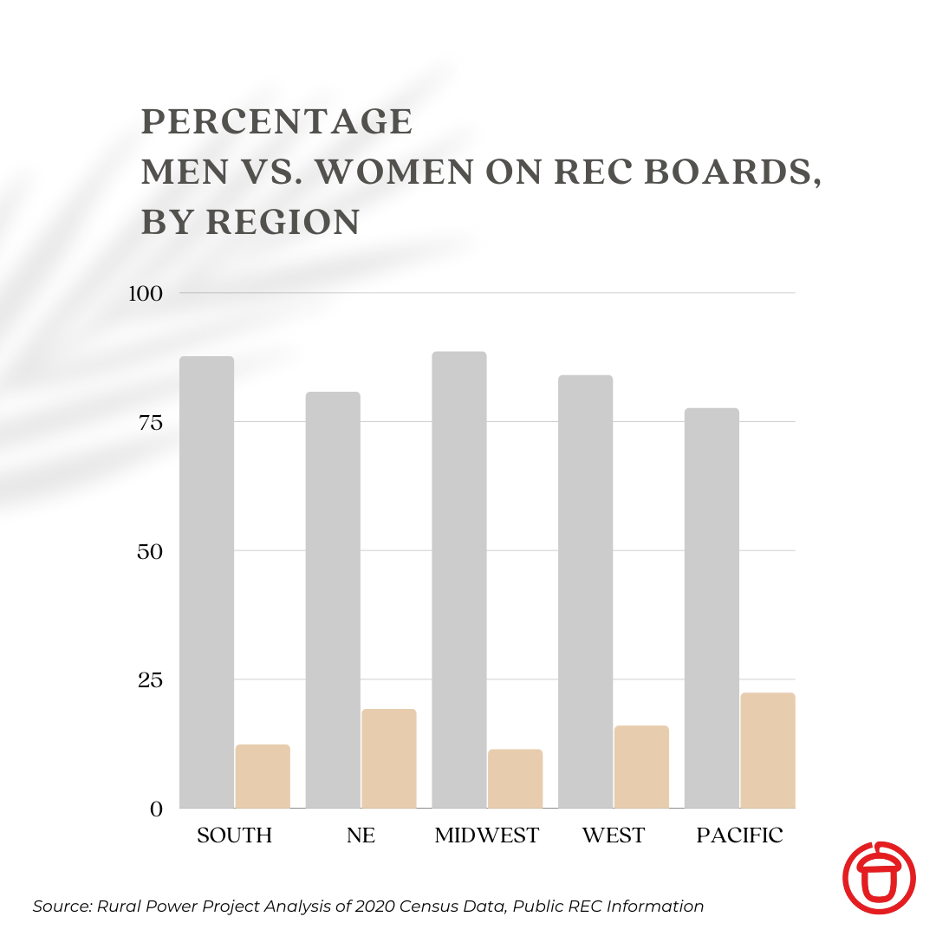
In every region of the country, there is an inordinate discrepancy between the amount of women who are customer-owners of RECs and the amount of women who lead those RECs.
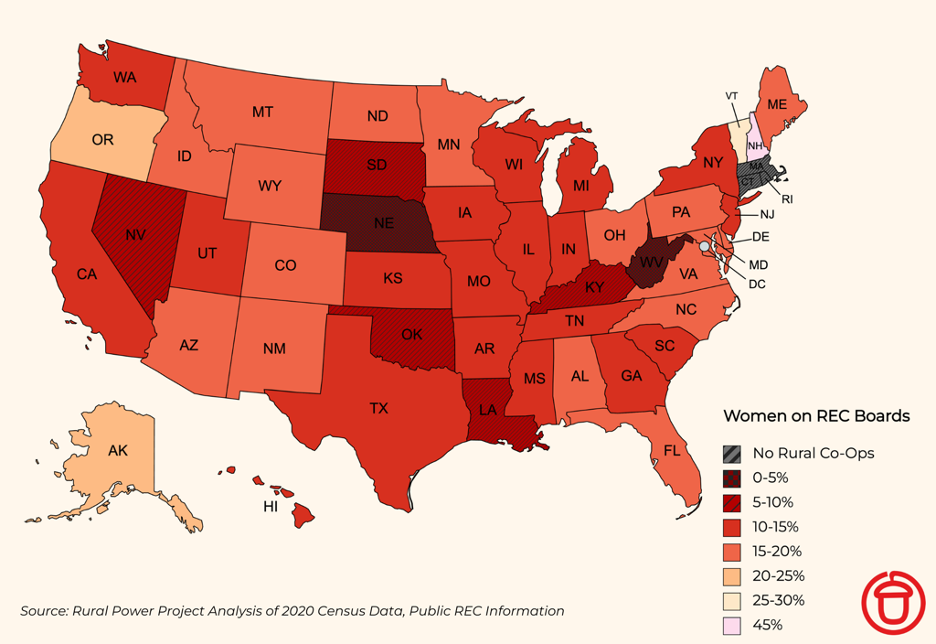
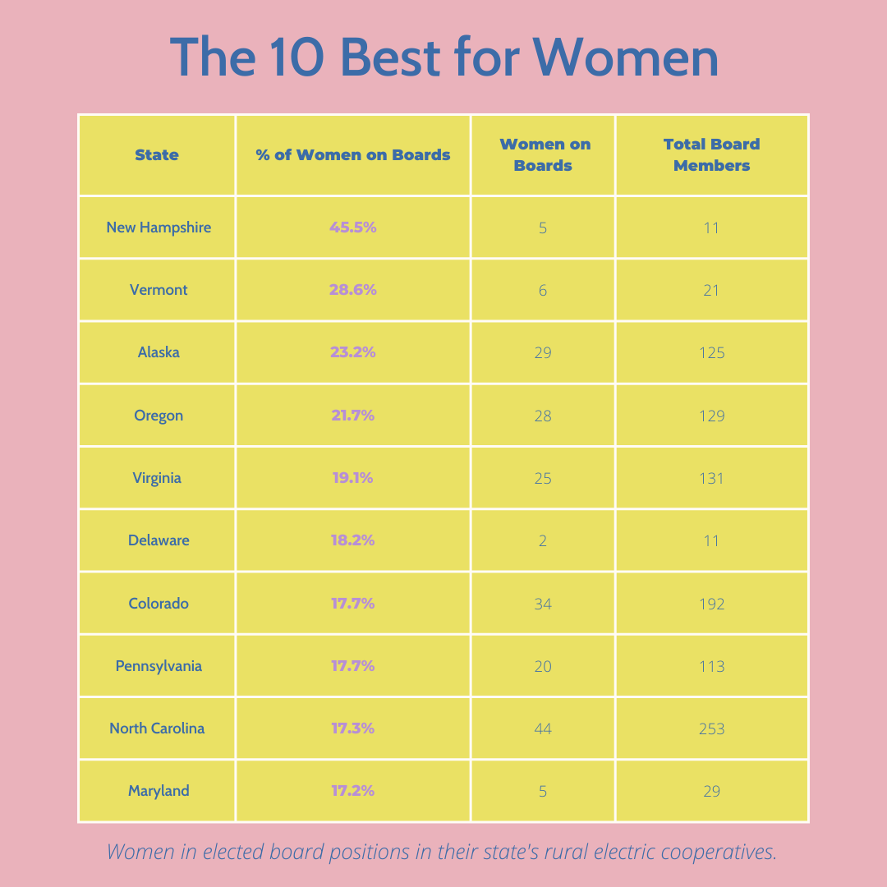
In no state in America do REC boards reflect the even split of the adult population. With 6 men and 5 women, New Hampshire’s one co-op board brings New Hampshire the closest. Vermont is next but far behind at 28.6% women – 6 of the 21 board members for its two RECs.
Outside of New England, where electric cooperatives are rare, Alaska has the best rate of women’s representation. That rate is only 23.2%, with 29 women among its 125 elected board leaders. Less than a quarter women, and Alaska is the nation’s leader. It’s all downhill from that sorry peak.
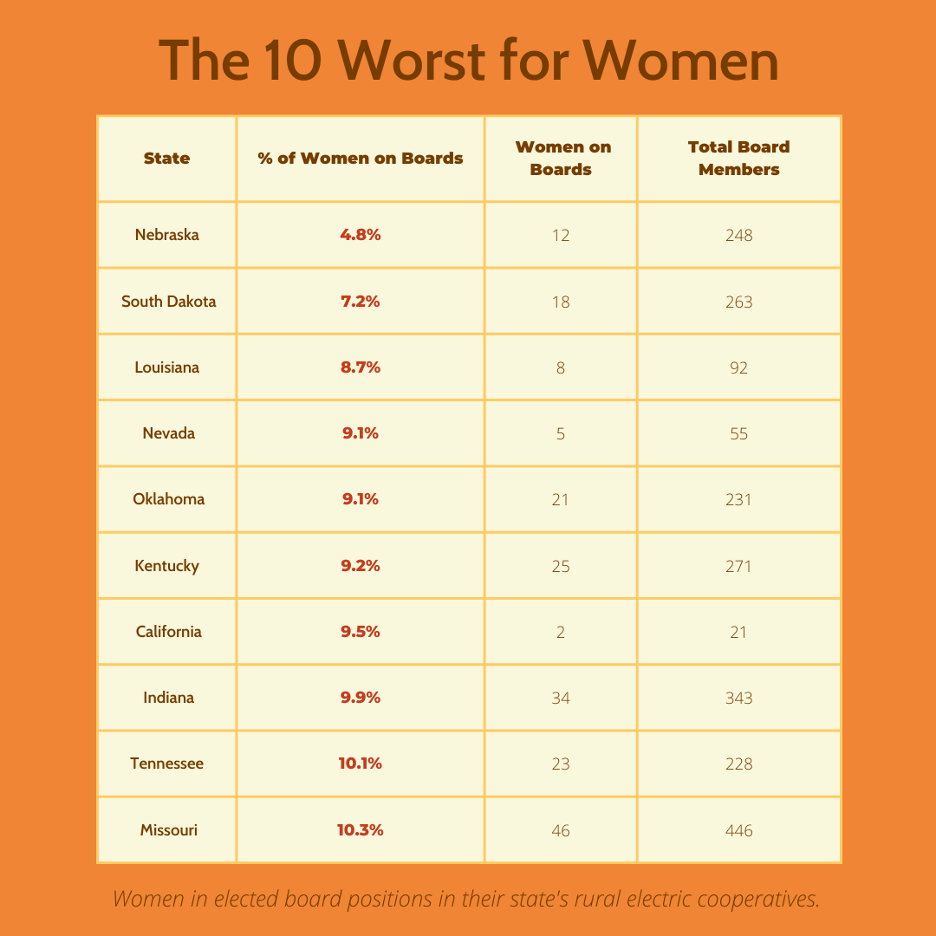
Everywhere comes up short, but some come up shorter than others. West Virginia’s REC has no women on its board.
After West Virginia’s 0, Nebraska has the worst rate of women’s representation. Nebraska justifiably boasts that it is the only state whose electric utilities are all public. This includes power districts where board candidates appear on the same ballot where people choose their local and state officials. But only 12 of the 248 REC and power district board members are women: 4.8%.
In South Dakota it’s just 7.2%, Louisiana it’s 8.7%. Nevada (9.1%), Oklahoma (9.1%), and Kentucky (9.2%) are virtually tied for fifth worst for women’s representation and California is close behind at 9.5%.
There were 270 cooperatives where we identified no women at all in board positions. That’s 30% of all co-ops without a single female elected leader.
Grossly Underrepresented: REC Boards Effectively a Whites-Only Club
As a 2021 Brookings Institution study of rural demographics put it, “[c]ontrary to the dominant narratives that use ‘rural’ as a synonym for ‘white,’ 24% of rural Americans were people of color in 2020.”[3] Were REC boards in line with this trend, we’d expect that no more than 76% of board members would be held by white people.
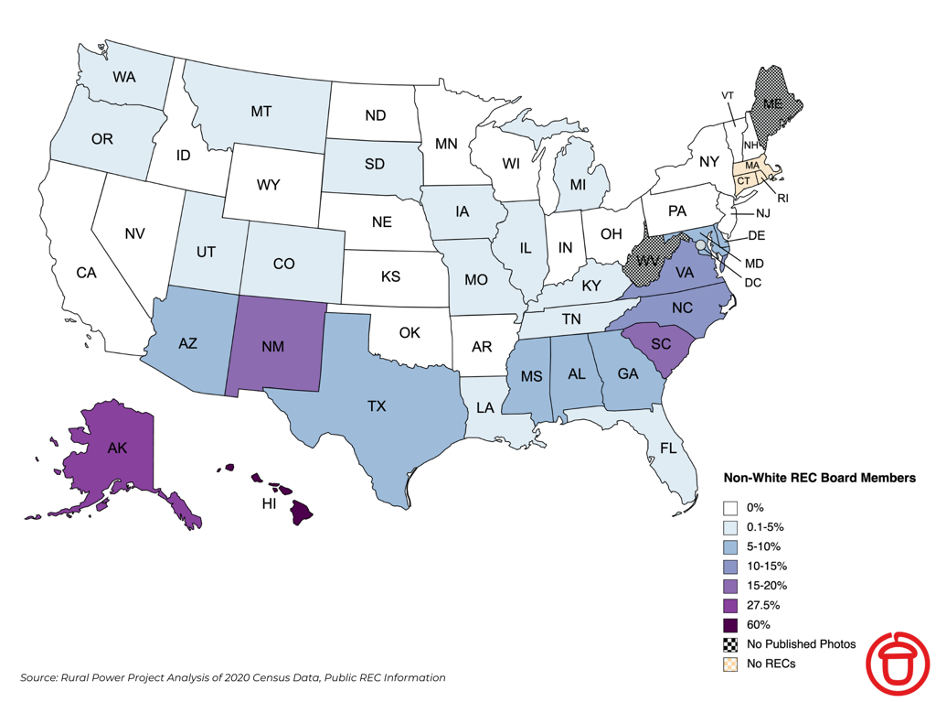
But they do not reflect the trend; they don’t even come close. People of color – a quarter of rural America’s people – are virtually shut out of the governance of the cooperatives they own. Of the 6,198 REC board members across the country for whom we could make a reasonable determination about racial identity, 96% were white. Just 2.4% were Black, 0.9% Hispanic, 0.5% Native American, and 0.2% Asian American.
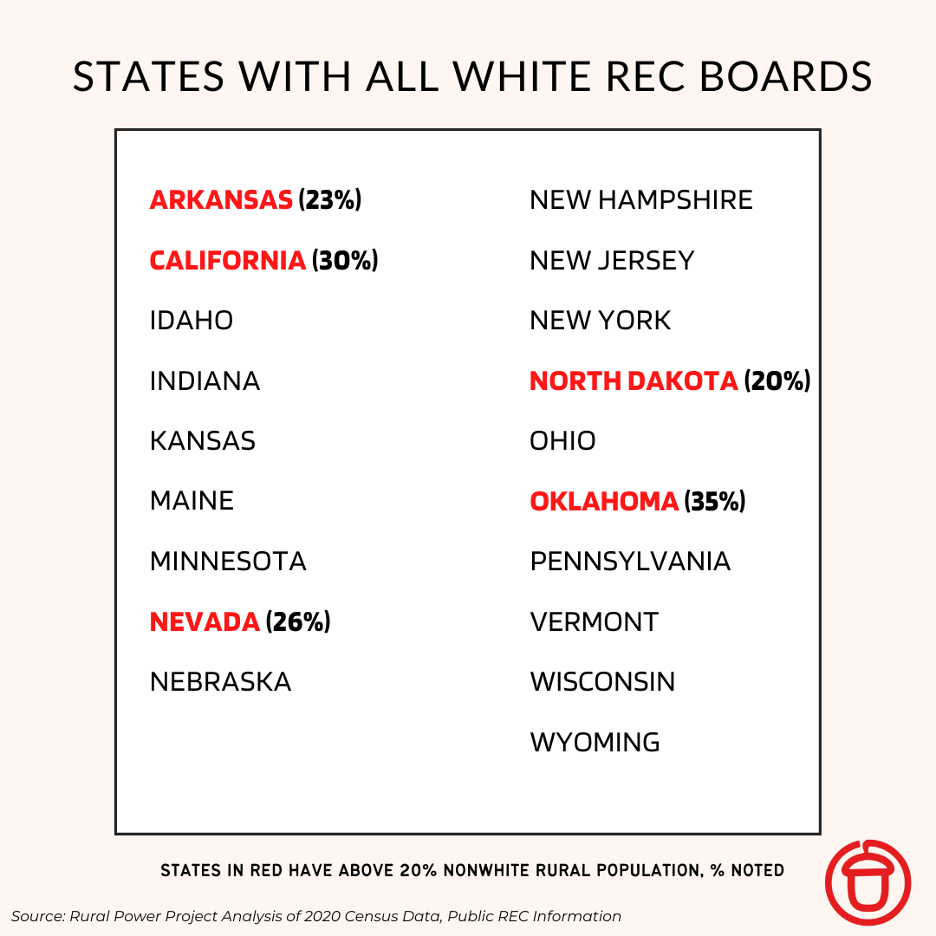
Of 697 cooperative boards whose racial demographics we could assess, 557 of those boards–80% –were all white.
While people of color make up majorities of 10% of rural counties[4], there were only 11 majority nonwhite cooperative boards (1.6%):
- Alaska Village Electric Cooperative, Inc. (Alaska)
- Mora-San Miguel Electric (New Mexico)
- Barrow Utilities & Electric Cooperative (Alaska)
- Inside Passage Electric Cooperative (Alaska)
- Roanoke Electric Cooperative (North Carolina)
- Jemez Mountains Electric Cooperative (New Mexico)
- Northern Rio Arriba Electric (New Mexico)
- Kaua’i Island Utility Cooperative (Hawaii)
- Magic Valley Electric Cooperative Inc (Texas)
- Tri-County Electric Cooperative (South Carolina)
- Berkeley Electric Cooperative (South Carolina)
19 states had no people of color on any of their REC boards.
Comparing Rural County Populations to Rural Co-op Leaderships
Some states’ rural areas are more diverse than others. We aimed to get a sense of the demographics of each state’s rural population by filtering 2020 Census data down to just counties the Census defines as majority rural – i.e., the majority of the county’s population live in a rural area[5]. This doesn’t quite get us to a picture of the customer-owner base of rural electricity cooperatives. For one thing, there are only 36 million people in majority rural counties, while “rural” electricity cooperatives serve some 42 million people. But this method gets us closer to a view of the people who ostensibly own cooperatives than statistics including urban counties would. If anything, we believe our method of estimating rural demographics underestimates the diversity of RECs customer-owner population, as co-op service areas reach in, out of, and around rural areas.
Nevertheless, our analysis gave the lie to the idea that REC boards are all white simply because only white people live in rural counties. It’s just not true. In fact, no state we surveyed had board demographics that reflected the diversity of its rural population. Not even in states like Kentucky, Nebraska, Illinois, and Vermont, where whites make up at least 90% of majority rural counties. If Kentucky’s REC boards reflected the diversity of rural counties, they’d have at least 22 nonwhite board members, not just 3.
The table below includes some states that stand out in terms of how deeply people of color are disenfranchised by their state’s co-ops. It includes the percentage of non-white people in the state’s majority rural counties, the percentage of non-white people on the state’s REC boards, and a minimum of how many additional board seats would need to be held by people of color for the REC boards to accurately reflect their state’s rural population. Check out the online version of this report for a deeper dive into each state’s demographics.
Conclusion
That rural electricity cooperatives have monolithically white, male leadership flies in the face of their intended purpose: to allow rural citizens – all rural citizens – to govern their own utilities for their own benefit.
The cooperatives themselves, where white men have created a walled off leadership clique, suffer from their exclusion of women and minorities. The longer they resist welcoming their diversifying membership base, the more they fail to meet today’s challenges. It’s been demonstrated over and over again that diversity benefits organizations of all kinds in all kinds of ways: it improves business outcomes, leads to greater innovation, makes for better returns on investment… the list goes on. RECs are actively turning their backs on these benefits.
In a time of growing threats from a warming climate, an aging energy grid, and rapidly rising energy costs, RECs could play a leading role in finding a way out of crises created by our investor driven economy. But unfortunately for the 42 million Americans they serve, and indeed, all of us, RECs are facing squarely backward.
This report also appears in the Summer 2022 issue of Social Policy and on the websites of the Labor Neighbor Research & Training Center (LNRTC) and the Rural Power Project (RPP).
Footnotes
[1] “Democracy Lost and Discrimination Found,” The Rural Power Project, 2016.
[2] U.S. Census Bureau, 2011-2015 American Community Survey 5-year estimates
[3] “Mapping rural America’s diversity and demographic change.” Rowlands, DW and Hanna Love. Metropolitan Policy Program at Brookings. 28 September 2021. Available online at https://tinyurl.com/bde9yj3.
[4] Rowlands and Love, “Mapping…”. Available online at https://tinyurl.com/bde9yj3.
[5] County Rurality Map in US Census Bureau’s “Rural America” ArcGIS Story Map, accessible online at: https://arcg.is/0ieX00
Appendices
States Ranked by Severity of Underrepresentation of Racial Minorities on Boards
| State | Non-White Pop. Rural Counties | Non-White REC Board Members | |
| 1 | Arizona | 64% | 10% |
| 2 | New Mexico | 70% | 19% |
| 3 | Oklahoma | 35% | 0% |
| 4 | Mississippi | 41% | 8% |
| 5 | Louisiana | 35% | 3% |
| 6 | Texas | 35% | 5% |
| 7 | California | 30% | 0% |
| 8 | South Carolina | 44% | 16% |
| 9 | Florida | 29% | 2% |
| 10 | South Dakota | 28% | 2% |
| 11 | Nevada | 26% | 0% |
| 12 | Georgia | 31% | 6% |
| 13 | Oregon | 27% | 3% |
| 14 | Arkansas | 23% | 0% |
| 15 | Colorado | 23% | 1% |
| 16 | North Dakota | 20% | 0% |
| 17 | North Carolina | 32% | 12% |
| 18 | New York | 20% | 0% |
| 19 | Alabama | 29% | 9% |
| 20 | Washington | 21% | 2% |
| 21 | Idaho | 19% | 0% |
| 22 | Wyoming | 18% | 0% |
| 23 | New Jersey | 18% | 0% |
| 24 | Virginia | 26% | 11% |
| 25 | Maryland | 25% | 10% |
| 26 | Alaska | 42% | 28% |
| 27 | Montana | 17% | 2% |
| 28 | Kansas | 13% | 0% |
| 29 | Utah | 18% | 4% |
| 30 | Minnesota | 12% | 0% |
| 31 | Nebraska* | 11% | 0% |
| 32 | Tennessee | 14% | 4% |
| 33 | Michigan | 12% | 2% |
| 34 | Indiana | 10% | 0% |
| 35 | Wisconsin | 10% | 0% |
| 36 | New Hampshire | 10% | 0% |
| 37 | Missouri | 11% | 1% |
| 38 | Illinois | 10% | 0% |
| 39 | Vermont | 9% | 0% |
| 40 | Iowa | 9% | 0% |
| 41 | Pennsylvania | 9% | 0% |
| 42 | Kentucky | 10% | 1% |
| 43 | Ohio | 8% | 0% |
* Maine and West Virginia are not included because their RECs did not make information about their board members public. Delaware and Hawaii do not have any majority rural counties and could not be assessed using this method. Rhode Island, Connecticut, and Massachusetts do not have any RECs.
States Ranked by Severity of Underrepresentation of Women
| State | Women on REC Boards | |
| 1 | West Virginia* – One Co-Op | 0% |
| 2 | Nebraska* – includes districts | 4.8% |
| 3 | South Dakota | 7.2% |
| 4 | Louisiana | 8.7% |
| 5 | Oklahoma | 9% |
| 6 | Nevada | 9% |
| 7 | Kentucky | 9.2% |
| 8 | California | 10% |
| 9 | Indiana | 10% |
| 10 | Minnesota | 10% |
| 11 | Tennessee | 10.1% |
| 12 | Missouri | 10% |
| 13 | Texas | 10.7% |
| 14 | Kansas | 11% |
| 15 | Iowa | 11% |
| 16 | Mississippi | 11.1% |
| 17 | Hawaii* | 11% |
| 18 | Utah | 11% |
| 19 | Ohio | 11% |
| 20 | South Carolina | 12.0% |
| 21 | New Jersey | 13% |
| 22 | Illinois | 13% |
| 23 | Arkansas | 12.9% |
| 24 | New York | 13% |
| 25 | Georgia | 13.4% |
| 26 | Washington | 14% |
| 27 | Wisconsin | 14% |
| 28 | Michigan | 14% |
| 29 | North Dakota | 15% |
| 30 | Idaho | 15% |
| 31 | Alabama | 15.1% |
| 32 | Wyoming | 15% |
| 33 | Florida | 15.7% |
| 34 | New Mexico | 16% |
| 35 | Montana | 17% |
| 36 | Arizona | 17% |
| 37 | Maine | 17% |
| 38 | Maryland | 17% |
| 39 | North Carolina | 17.3% |
| 40 | Pennsylvania | 18% |
| 41 | Colorado | 18% |
| 42 | Delaware* | 18% |
| 43 | Virginia | 19.1% |
| 44 | Oregon | 22% |
| 45 | Alaska | 23% |
| 46 | Vermont | 29% |
| 47 | New Hampshire | 45% |